Turnover Ratio-Creditor, Debtor & Inventory
Blog post description.
11/6/20234 min read
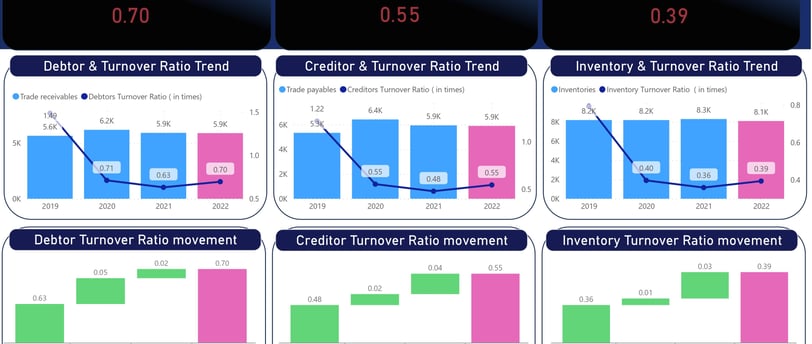
in the data, we're comparing the Creditor Turnover Ratio for 2019 and 2020 and stating that the turnover ratio decreased due to changes in cost and payables. Specifically, we mentioned the following figures:
Creditor Turnover Ratio for 2021: 63 days
Creditor Turnover Ratio for 2022: 55 days
Change in cost: -62 days
Change in payables: 54 days
Let's break down what these numbers mean:
Creditor Turnover Ratio for 2021: 63 days:
This indicates that, on average, it took the company about 63 days to pay its trade creditors in 2019. In other words, the company paid its suppliers approximately every 63 days.
Creditor Turnover Ratio for 2022: 55 days:
This shows that, on average, it took the company about 55 days to pay its trade creditors in 2020. In 2020, the company paid its suppliers approximately every 55 days.
Change in cost: -62 days:
A negative change in cost implies that the company's cost of goods sold (COGS) has decreased significantly, leading to a negative impact on the creditor turnover ratio. In this case, the decrease in COGS contributed to paying suppliers more frequently.
Change in payables: 54 days:
An increase in payables (accounts payable) by 54 days means that the company extended the payment period to its suppliers. This change in payables contributed to a longer time it takes to pay suppliers on average.
Overall, here's what the numbers signify:
The creditor turnover ratio decreased from 63 days in 2021 to 55 days in 2022. This indicates that, on average, the company paid its suppliers more promptly in 2022 compared to 2021.
The significant decrease in COGS contributed to this change, suggesting that the company managed to reduce its cost of goods sold and pay its suppliers more frequently.
The increase in payables (accounts payable) by 54 days means that the company took longer to settle its supplier bills, which is not typically favorable for suppliers but can indicate that the company had more extended payment terms.
In summary, the changes in cost and payables had a combined effect on the creditor turnover ratio, leading to a shorter time frame for paying suppliers in 2022 compared to 2021.
Debtor Turnover Ratio
We're comparing the Debtor Turnover Ratio for 2022 and 2021 and noting that the turnover ratio decreased. Specifically, you mentioned the following figures:
Debtor Turnover Ratio for 2022: 43 days
Debtor Turnover Ratio for 2021: 47 days
Change in sales: -49 days
Change in receivables: 43 days
Let's break down what these numbers mean:
Debtor Turnover Ratio for 2022: 43 days:
This indicates that, on average, it took the company about 43 days to collect payments from its debtors (customers) in 2022. In other words, the company collected payments from customers approximately every 43 days.
Debtor Turnover Ratio for 2021: 47 days:
This shows that, on average, it took the company about 47 days to collect payments from its customers in 2019. In 2019, the company collected payments from customers approximately every 47 days.
Change in sales: -49 days:
A negative change in sales suggests that the company's sales decreased significantly, leading to a negative impact on the Debtor Turnover Ratio. In this case, the decrease in sales contributed to a longer time to collect payments from customers.
Change in receivables: 43 days:
An increase in receivables (accounts receivable) by 43 days means that the company's outstanding customer invoices took longer to collect. This change in receivables contributed to a longer time to collect payments from customers.
Here's what these numbers signify:
The Debtor Turnover Ratio decreased from 47 days in 2021 to 43 days in 2022. This indicates that, on average, the company took longer to collect payments from customers in 2022 compared to 2021.
The significant decrease in sales contributed to this change, indicating that the company experienced reduced sales volume, which had an adverse effect on the Debtor Turnover Ratio.
The increase in receivables (accounts receivable) by 43 days implies that the company's outstanding customer invoices took longer to collect, further contributing to the longer time required to collect payments from customers in 2022.
In summary, the changes in sales and receivables had a combined effect on the Debtor Turnover Ratio, leading to a longer time to collect payments from customers in 2022 compared to 2021.
Inventory Turnover ratio
We're comparing the Inventory Turnover Ratio for 2022 and 2021 and noting that the turnover ratio decreased. Specifically, you mentioned the following figures:
Inventory Turnover Ratio for 2022: 76 days
Inventory Turnover Ratio for 2021: 83 days
Change in cost: -83 days
Change in inventory: 76 days
Let's break down what these numbers mean:
Inventory Turnover Ratio for 2022: 76 days:
This indicates that, on average, it took the company about 76 days to sell and replace its entire inventory in 2022. In other words, the company went through its inventory approximately every 76 days.
Inventory Turnover Ratio for 2021: 83 days:
This shows that, on average, it took the company about 83 days to sell and replace its entire inventory in 2021. In 2021, the company went through its inventory approximately every 83 days.
Change in cost: -83 days:
A negative change in cost implies that the company's cost of goods sold (COGS) has decreased significantly, leading to a negative impact on the Inventory Turnover Ratio. In this case, the decrease in COGS contributed to a shorter time to sell and replace inventory.
Change in inventory: 76 days:
An increase in inventory means that the company had more inventory on hand. This change in inventory contributed to a longer time to sell and replace inventory.
Here's what these numbers signify:
The Inventory Turnover Ratio decreased from 83 days in 2021 to 76 days in 2022. This indicates that, on average, the company sold and replaced its inventory more quickly in 2022 compared to 2021.
The significant decrease in COGS contributed to this change, suggesting that the company managed to reduce its cost of goods sold and sell inventory more rapidly.
The increase in inventory implies that the company had more inventory on hand, which extended the time required to sell and replace inventory.
In summary, the changes in cost and inventory had a combined effect on the Inventory Turnover Ratio, leading to a shorter time to sell and replace inventory in 2022 compared to 2021.