Sales and Gross margin analysis by Product Category
Title: Maximizing Business Insights: A Power BI Dashboard for Sales and Gross Margin Analysis
Prateek
Title: Maximizing Business Insights: A Power BI Dashboard for Sales and Gross Margin Analysis
Introduction
In today's data-driven business landscape, the ability to make informed decisions is critical for success. Power BI, a potent business intelligence tool developed by Microsoft, equips organizations to convert raw data into actionable insights. In this SEO-friendly blog, we'll delve into a comprehensive Power BI dashboard that uncovers trends in sales and gross margin, compares average prices to average costs, and scrutinizes sales and gross margin variances over the past year. Join us on this data-driven journey to enhance your decision-making processes.
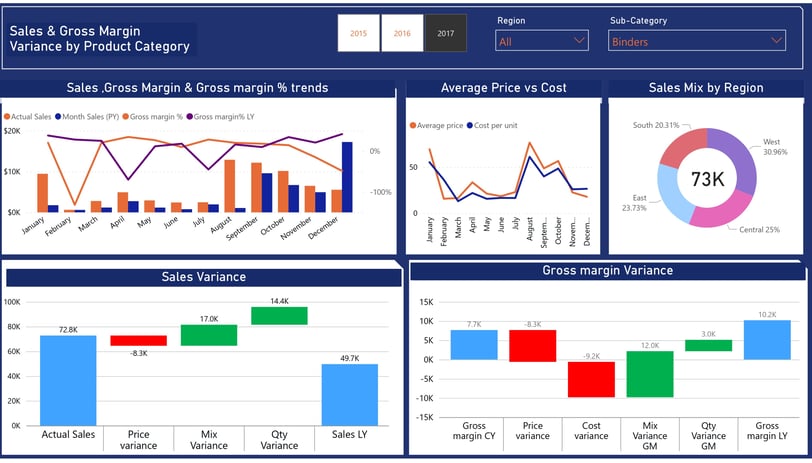
Sales and Gross Margin Trends
Any robust business intelligence dashboard must offer a clear perspective on sales and gross margin trends. Our Power BI dashboard presents visually appealing, insightful line charts that highlight the evolution of sales and gross margin over time, whether on a monthly, quarterly, or annual basis. This dynamic visualization empowers you to monitor performance, identify patterns, and pinpoint fluctuations, enabling you to fine-tune your strategies in response to changing market conditions.
Average Price vs. Average Cost
The dashboard also includes a section dedicated to comparing the average price of your products with the average cost. This information is pivotal for comprehending your profit margins. Through an easily digestible line chart, you can instantly grasp the relationship between these two factors. When the average price exceeds the average cost, it signifies robust profit margins. Conversely, when the average price lags behind the average cost, it's time to rethink your pricing strategy.
Sales Mix by Region
Understanding the sales mix by region is essential for effective resource allocation and targeted marketing. The Power BI dashboard allows you to analyze sales distribution across various regions using engaging visualizations such as pie charts. This data-driven insight will guide your business in directing resources to high-performing regions and seizing growth opportunities in underperforming areas.
Sales Variance Over the Last Year
Monitoring sales variance is a fundamental aspect of financial analysis. Waterfall chart offers an in-depth analysis of sales variance over the past year, breaking it down into three crucial components: price, quantity, and mix. This detailed breakdown enables you to pinpoint the specific factors driving changes in your sales performance. Is it primarily driven by price changes, shifts in product mix, or fluctuations in the quantity of products sold? Visual charts and tables offer clarity in your analysis.
Gross Margin Variance Over the Last Year
Much like sales variance, the dashboard provides an extensive examination of gross margin variance over the past year, further segmented into four key components: price, quantity, mix, and cost. By dissecting these aspects individually, you can identify the factors contributing to changes in your gross margin. Is it rising costs, pricing adjustments, product mix variations, or quantity fluctuations affecting your margin? This granular level of detail equips you with actionable insights for optimizing your gross margin.
Conclusion
In conclusion, the Power BI dashboard we've explored here provides a comprehensive view of your business's sales and gross margin performance. By understanding sales and gross margin trends, comparing average prices with average costs, analyzing sales mix by region, and dissecting variances over the last year, you can make more informed decisions to drive your business forward. Power BI's ability to transform complex data into actionable insights is an invaluable asset for any organization, enabling you to adapt and thrive in an ever-changing business landscape. With this dashboard in your toolkit, you're better equipped to navigate the challenges and opportunities that come your way.
.