Competition Analysis Power BI Dashboard
10/31/20232 min read
In today's fiercely competitive business landscape, staying ahead of the competition is crucial for long-term success. To gain a competitive edge, companies need to analyze their performance and compare it with their rivals. One effective way to achieve this is through a comprehensive competition analysis Power BI dashboard.
This blog post will delve into the power of a competition analysis Power BI dashboard and how it can provide valuable insights into sales and market share. We will focus on comparing the 5-year sales of four companies and calculating the Compound Annual Growth Rate (CAGR) using a column chart. Additionally, we will explore the market share distribution over the same period, both by sales and quantity.
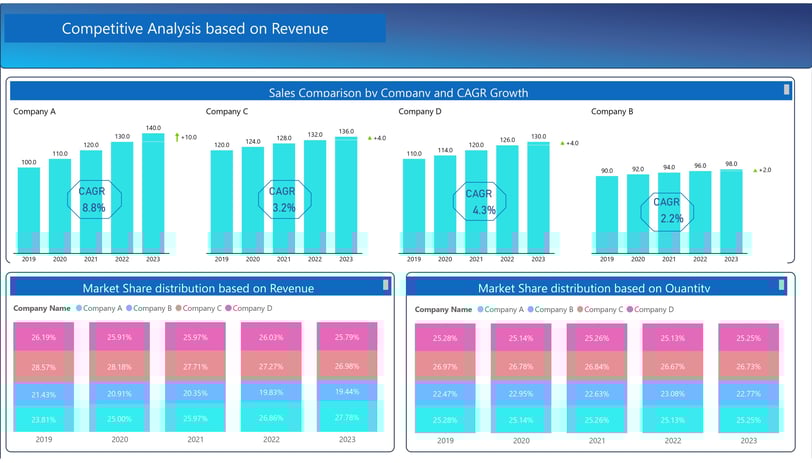
Comparing 5-Year Sales and Calculating CAGR
The first aspect we will address in the competition analysis Power BI dashboard is the comparison of 5-year sales for four different companies. By visualizing this data using a column chart, we can easily identify trends, patterns, and outliers.
Furthermore, we will calculate the Compound Annual Growth Rate (CAGR) for each company. CAGR is a crucial metric that helps determine the growth rate over a specific period. By incorporating this information into the dashboard, companies can assess their performance against competitors and make informed strategic decisions.
Market Share Distribution by Sales
Understanding market share is vital for businesses aiming to expand their customer base and increase their revenue. The competition analysis Power BI dashboard will showcase the market share distribution for the five-year period, focusing on sales.
By visualizing the market share distribution, companies can gain insights into their position in the market and identify potential areas for improvement. This information can be used to develop targeted marketing strategies, optimize pricing strategies, and enhance overall competitiveness.
Market Share Distribution by Quantity
While sales provide valuable insights, analyzing market share by quantity is equally important. The competition analysis Power BI dashboard will also feature the market share distribution for the five-year period, this time focusing on quantity.
By examining market share by quantity, companies can identify trends in customer preferences and tailor their product offerings accordingly. This data can help businesses optimize their supply chain, manage inventory levels effectively, and meet customer demands more efficiently.
In conclusion, a competition analysis Power BI dashboard is a powerful tool for gaining insights into sales and market share. By comparing 5-year sales and calculating CAGR, companies can assess their performance against competitors. Additionally, analyzing market share distribution by sales and quantity provides valuable information for strategic decision-making. Incorporating these features into a Power BI dashboard enables businesses to stay ahead of the competition and drive long-term success.