Unleashing Insights through Data Analysis
Welcome to BIPROINSIGHT, your gateway to data-driven decision-making. We empower you with actionable insights through comprehensive data analysis and visualization.
Our interactive Power BI dashboard is designed to transform raw data into meaningful narratives, providing you with the clarity needed to make informed choices
What to Expect:
Dynamic Visualizations: Engage with our visually stunning Power BI dashboard that translates complex data into intuitive charts and graphs.
Interactive Exploration: Dive deep into your data. Click, filter, and interact with the dashboard to uncover hidden patterns and trends.
Data-Driven Decision Support: Leverage the power of analytics to make smarter decisions, backed by solid data.
Featured Insights:
Key Performance Indicators: Monitor crucial metrics at a glance.
Trend Analysis: Identify patterns and anticipate future developments.
Comparative Analytics: Benchmark performance and assess relative success.
Disclaimer Statement
All the data presented and analyzed on this website is obtained from publicly available sources/dummy data. We prioritize privacy and do not analyze data that could jeopardize personal information. Our data analysis is for research and educational purposes, using non-sensitive, publicly accessible data. We adhere to ethical data practices and privacy standards. If you have concerns about our data, please reach out to us.
ANALYSIS
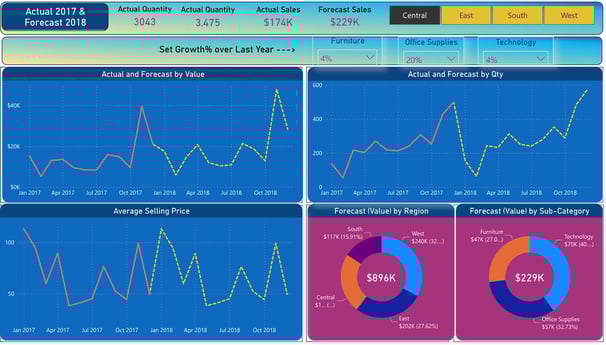
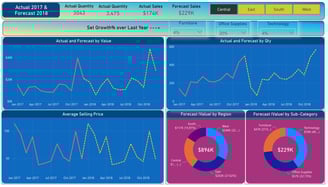
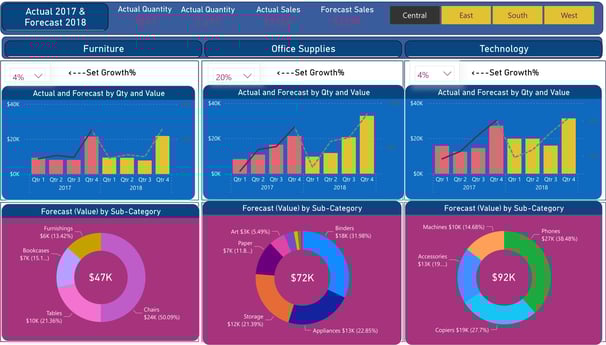
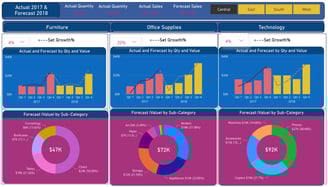
Forecasting with Dax
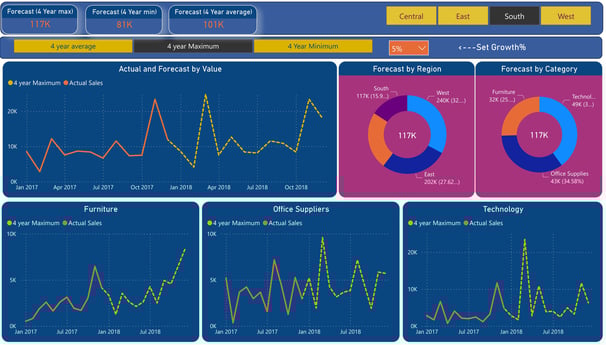
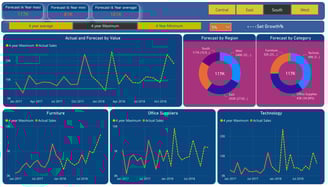
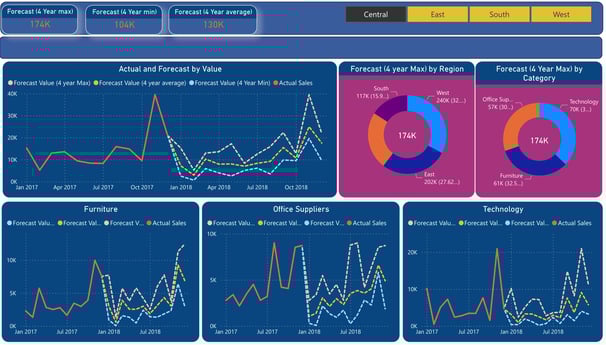
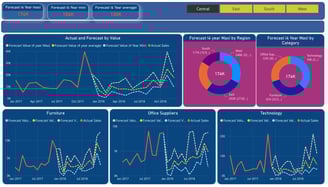
Forecasting based on 4 year Average ,maximum & Minimum Sales basis with expected growth %
Forecasting based on growth over same period last year

Know Your Business
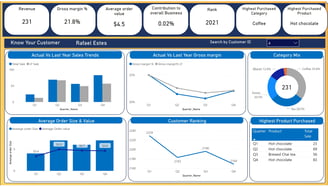
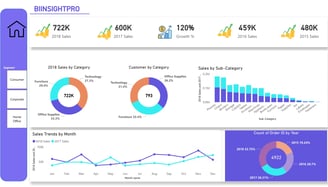
Know your Customer-Comprehensive snapshot of key Customer metrics and insights
The dashboard provides a comprehensive overview of customer data.
Actual Vs Last year Sales trends compares the current year's sales with sales from the previous year, organized by quarter. This chart helps track the growth or decline in sales over time.
Actual Vs Last year Gross margin trends displays the gross margin percentage, giving insights into the profitability of products or services.
Category Mix showcases the category mix, which highlights the distribution of sales across different product categories. This information can be useful for understanding customer preferences and market trends.
Average Order Size & Value reveals the average order size and value, allowing businesses to assess the purchasing behavior of their customers.
Customer ranking provides a clear overview of the ranking of customers by quarter. It allows us to identify the top customers and their contribution to our business during each quarter. Highest product purchased is crucial in understanding customer preferences and purchasing patterns. By analyzing this data, we can gain insights into which products are popular and adjust our marketing strategies accordingly.
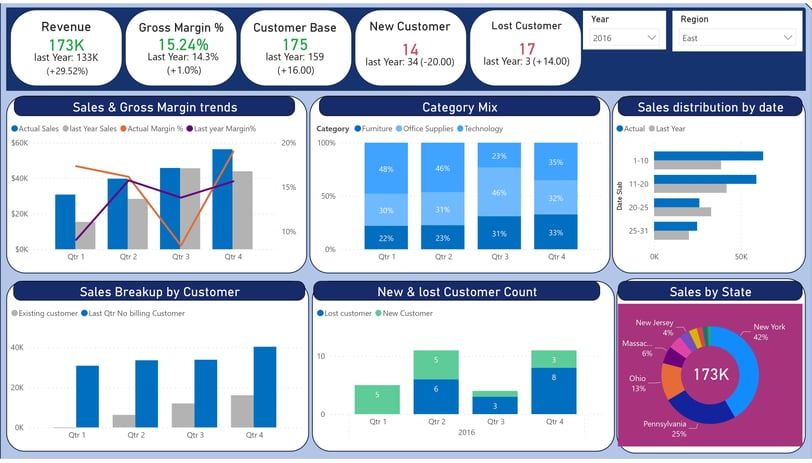
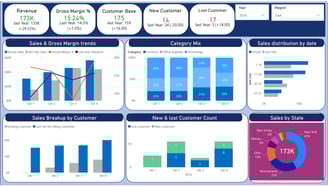
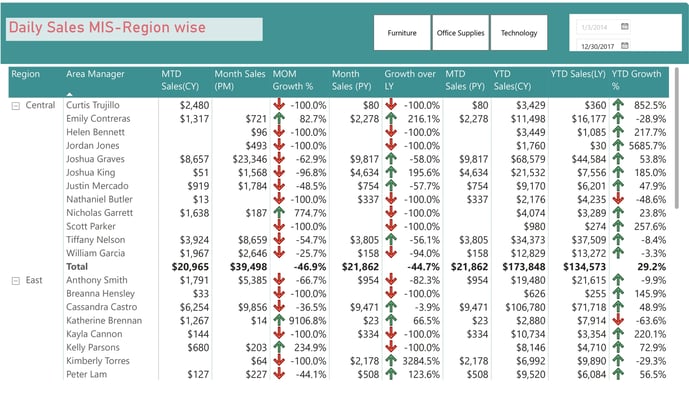
The dashboard provides an overview of the region's performance using various metrics.
Sales and gross margin trends by quarter, allowing for a comprehensive analysis of financial performance over time. Category mix by quarter is displayed, revealing the distribution of sales across different product categories and highlighting potential areas of growth or decline.
Sales distribution by date showcases the sales volume on a daily basis, providing insights into the sales patterns and identifying any fluctuations.
Sales breakup by customer, separating sales by customers who have not made any purchases in the last quarter from those made by existing customers.
It also tracks the number of new and lost customers each quarter, enabling a better understanding of customer acquisition and retention.
Finally, the sales mix by state highlights the performance of sales in different states, allowing for targeted strategies and resource allocation.
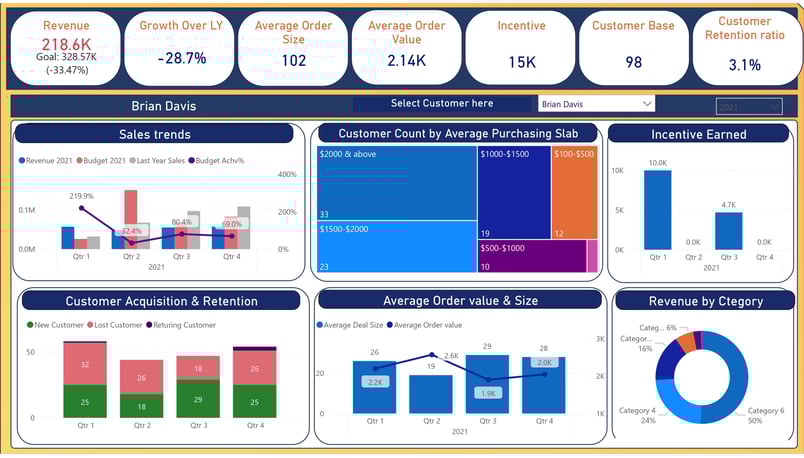
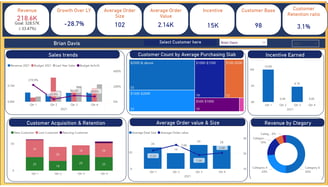
This dashboard provides a comprehensive analysis of the salesperson's performance.
It includes a comparison of sales trends between the current year and the previous year, as well as against the budget.
Additionally, the dashboard presents customer count data based on average purchase groups, allowing for a better understanding of customer behavior.
The incentive earned by the salesperson is also displayed, providing motivation for achieving sales targets.
The dashboard further highlights the customer acquisition and retention rates, distinguishing between new customers, lost customers, and returning customers.
By analyzing the average order value and average order size, the dashboard helps identify potential areas for improvement.
Lastly, the revenue breakdown by category assists in identifying the most profitable product categories.
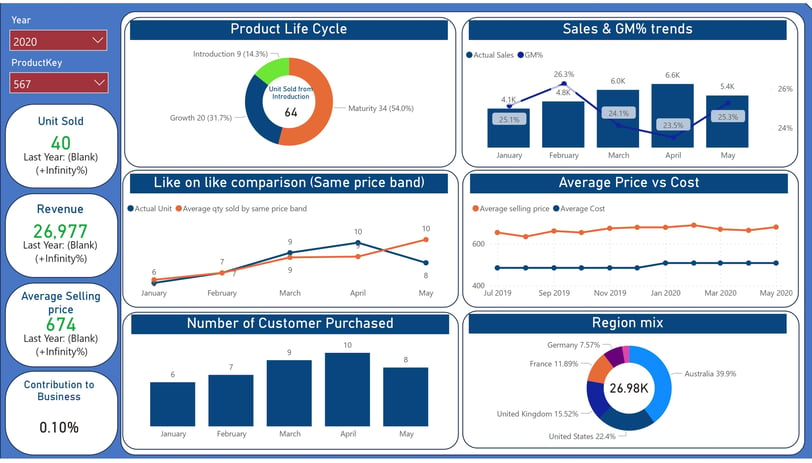
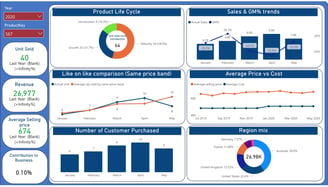
This dashboard provides various analyses related to product performance. Firstly, it presents the product life cycle, allowing the user to understand the stages of a product's existence from introduction to decline.
Secondly, it showcases sales and gross margin trends, enabling the user to track the financial performance of different products over time.
Another feature is the like-on-like comparison, which compares the quantity sold by a specific product with the average quantity sold by products in the same price band.
Additionally, the dashboard displays the average price versus cost, giving insights into the profitability of products.
Furthermore, it indicates the number of customers who have purchased a particular product, providing an understanding of customer demand. Lastly, the dashboard presents the product mix in different regions, allowing users to analyze the distribution of products across different geographical areas.
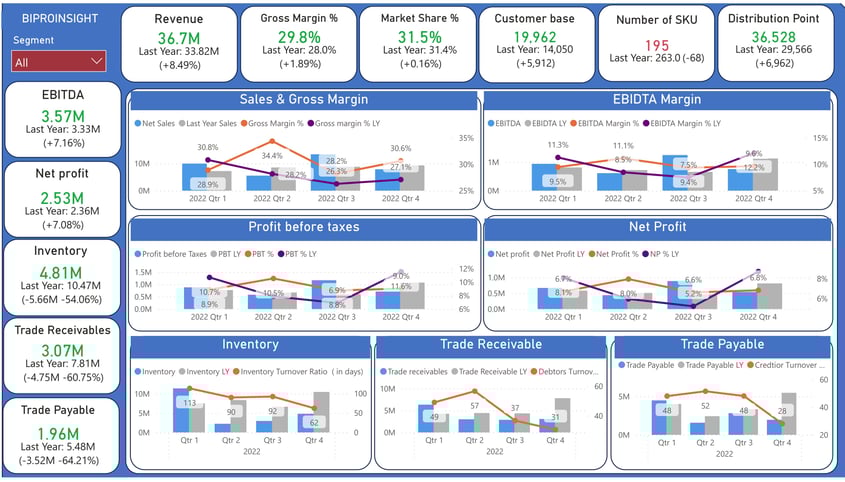
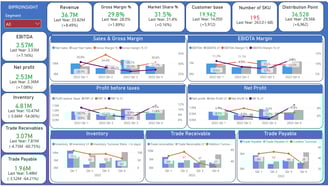
This dashboard provides a comprehensive analysis of various key performance indicators (KPIs) and financial data.
It includes the full-year revenue, gross margin, market share, customer base, number of SKUs, and number of distribution points.
Additionally, it shows financial KPIs such as EBITDA, net profit, inventory, trade receivables, and payables.
The dashboard also features charts that present the quarterly trends compared to the previous year for sales, gross margin, EBITDA margin, profit before taxes, net profit, inventory turnover ratio, as well as receivables and payables.
This allows for a detailed examination of the company's performance and financial health.
This dashboard provides the option to slice and filter data by segment. With the click of a button, users can switch between different segments, compare their performance, and make data-driven decisions accordingly.
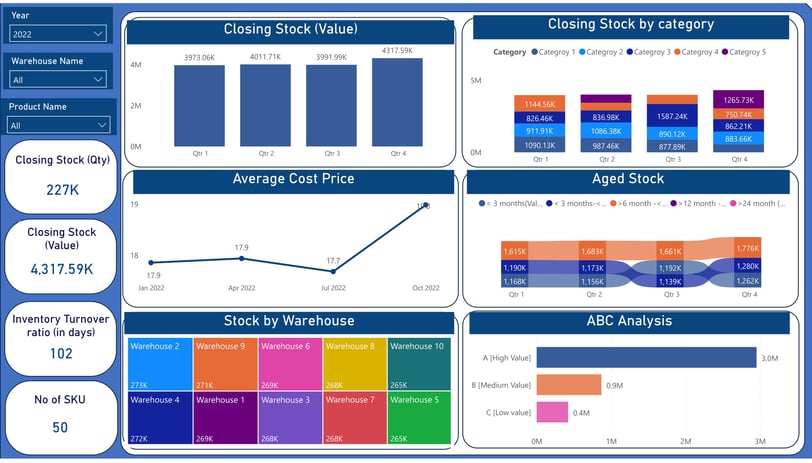
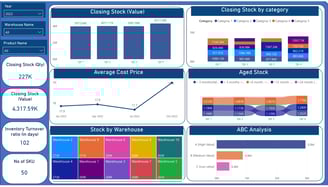
This dashboard provides a comprehensive analysis of various aspects related to stock management.
Firstly, it displays the closing stock by quarter, allowing users to track stock levels over time.
Additionally, it presents the closing stock categorized by different categories and each quarter, giving insights into the distribution of stock across various categories.
The average cost price by quarter is also showcased, enabling users to understand the cost trends associated with the stock.
Furthermore, the aged stock movement by quarter is displayed, helping users identify how long stock has been held and its movement patterns.
The dashboard also provides a breakdown of stock by warehouse, which aids in managing stock distribution across different locations.
Lastly, an ABC analysis is included, which prioritizes stock items based on their importance and value. Overall, this dashboard offers a comprehensive and detailed analysis of stock management.
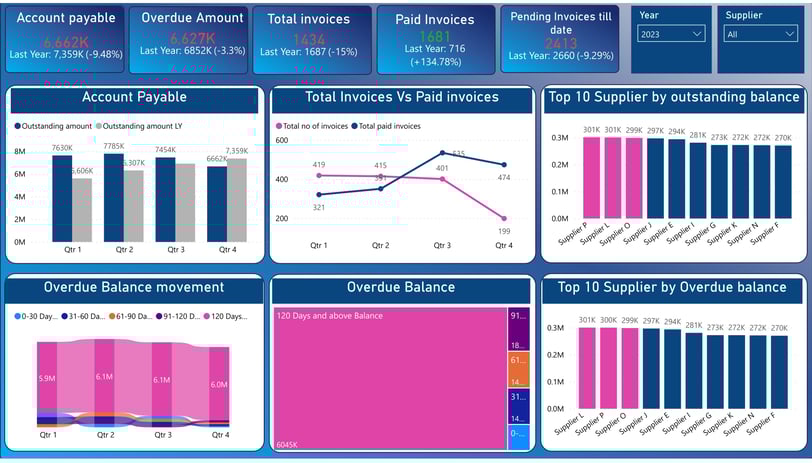
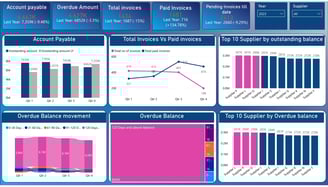
This dashboard provides various analyses related to supplier outstanding balances.
It includes a breakdown of outstanding balances by quarter, comparing the total number of invoices with the number of invoices that have been paid.
It also highlights the top 10 suppliers with the highest outstanding balances and tracks the movement of overdue balances.
In addition, it displays the total amount of overdue balances and identifies the top 10 suppliers with the highest overdue balances. These analyses offer valuable insights into the financial health and payment patterns of suppliers, allowing for better decision-making and proactive management of outstanding balances.
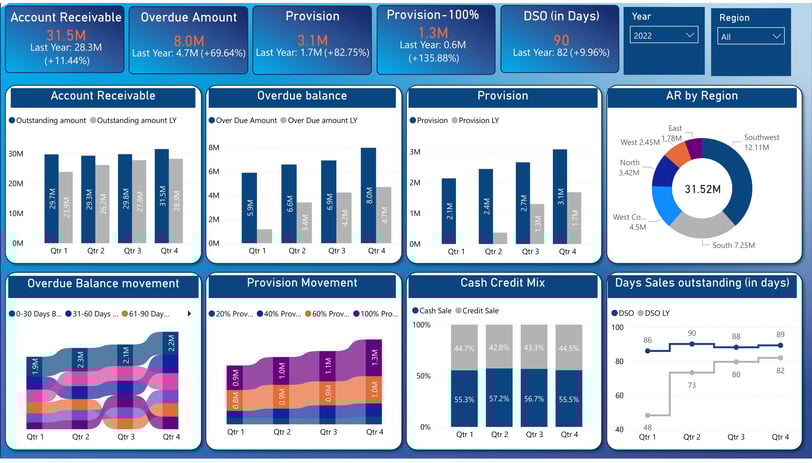

This dashboard is a comprehensive tool for analyzing receivable outstanding balances.
It offers a detailed breakdown of outstanding balances, overdue balance, and provision by quarter, allowing users to easily compare these figures with the same quarter from the previous year.
Furthermore, it tracks the movement of overdue balances and provision, providing valuable insights into the payment patterns of receivable.
Additionally, the dashboard displays the mix of cash credit sales and the days sales outstanding (DSO), which is a key metric for measuring the efficiency of receivables management.
By providing these analyses, the dashboard enables better decision-making and proactive management of outstanding balances, ultimately contributing to the overall financial health of the organization.
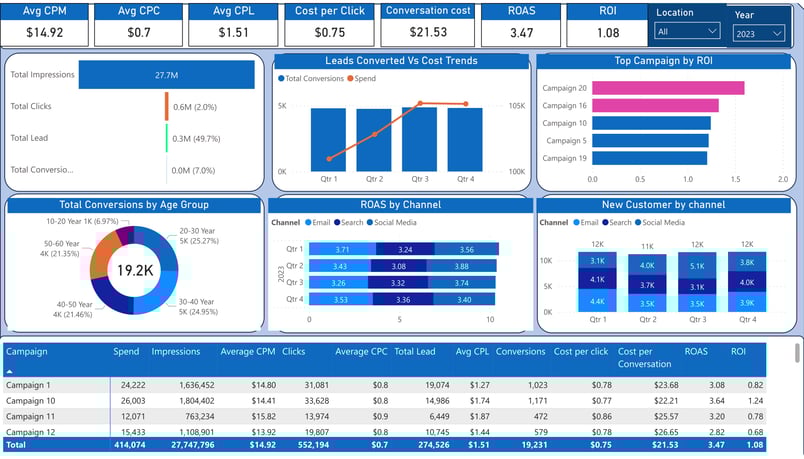
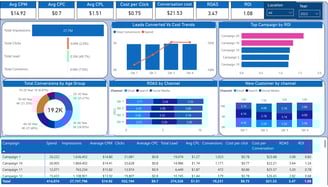
This marketing dashboard provides a comprehensive analysis of various marketing metrics. It includes a funnel chart that displays the total impressions, total clicks, total leads, and total conversions.
The lead conversion versus cost trends are also depicted, allowing for a clear understanding of cost-effectiveness. Additionally, the top campaign by return on investment (ROI) is identified, enabling marketers to optimize their strategies.
The dashboard also presents the conversation data categorized by age groups, facilitating targeted marketing efforts. Furthermore, the return on ad spend (ROAS) by channel is highlighted, helping marketers identify the most profitable advertising channels.
Lastly, the dashboard presents insights into new customer acquisition by channel, guiding marketers in identifying effective channels for acquiring new customers. With all these analyses, this marketing dashboard offers valuable insights for making data-driven marketing decisions.The dashboard provides a comprehensive matrix that displays important information for each campaign. This includes the total amount spent, the number of impressions generated, the average cost per thousand impressions (CPM), the average cost per click (CPC), the total number of leads acquired, the average cost per lead (CPL), the cost per click (CPC), the cost per conversation, the return on advertising spend (ROAS), and the return on investment (ROI). This matrix allows for a clear and concise overview of the performance of each campaign, enabling effective decision-making and optimization strategies.
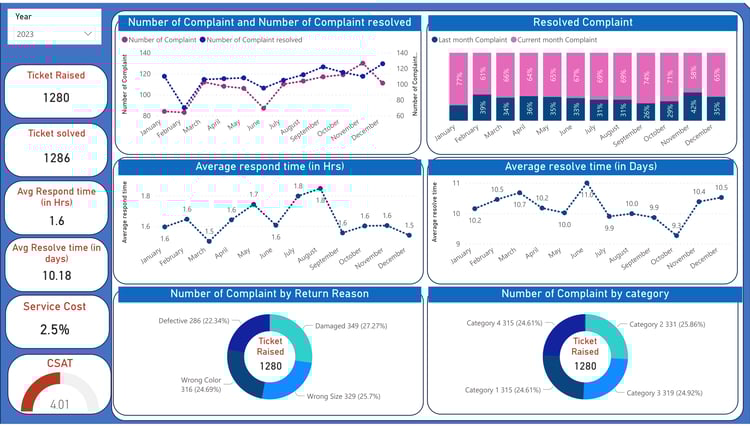
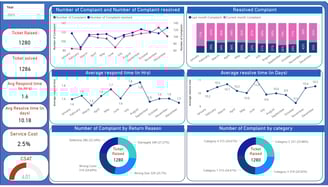
The after sales service dashboard provides a comprehensive analysis of various aspects.
It displays the number of complaints received versus the number of complaints resolved, giving a clear picture of the resolution rate.
Furthermore, it breaks down the resolved complaints, distinguishing between those related to the previous month and the current month. This breakdown provides useful insights into the trend of complaints over time.
Additionally, the dashboard calculates the average response time, allowing the company to assess its efficiency in handling customer concerns.
The average resolve time is also provided, giving an indication of the time taken to address and resolve complaints.
Moreover, the dashboard presents the number of complaints categorized by the reason for return and by category, enabling the identification of common issues and areas that require improvement.
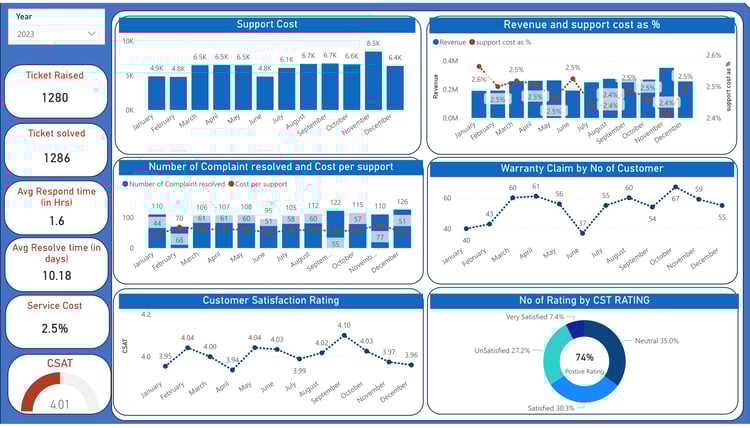
The dashboard provides an overview of support costs, revenue, and the percentage of support costs to revenue.
It also displays the number of complaints resolved and the cost per support.
Additionally, it shows the number of warranty claims based on the number of customers.
it includes customer satisfaction ratings by month and the breakdown of ratings into satisfied, very satisfied, and not satisfied. With this comprehensive display of information, users can easily track and analyze support costs, revenue, complaint resolution, warranty claims, and customer satisfaction.
Overall Business at a Glance: A Comprehensive Overview of Company's Performance
Know your Region's- a comprehensive understanding of key metrics and trends in your geographic areas
Know Your Product overview, encompassing key metrics and trends
Interview Snapshot-comprehensive overview of the current state of the inventory
Know Your Receivable overview- offering insights into outstanding payments and receivables management
Know Your Trade Payable-offering insights into outstanding payables and vendor management
Know Your Sales Person performance-enhancing decision-making and team strategy
Know Your Marketing overview- providing insights into key campaigns, metrics, and trends
Know Your After-Sales Service overview- offering insights into key performance indicators and customer support trends
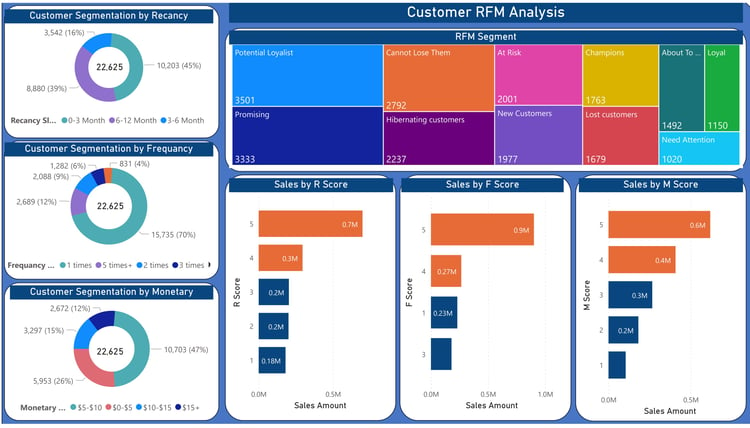
Unlocking Customer Insights: RFM Analysis for Targeted Marketing Success
RFM Analysis is a powerful tool used in marketing and customer relationship management. It stands for Recency, Frequency, and Monetary Value.
This analysis helps businesses identify and segment their customers based on their purchasing behavior.
Recency refers to the time since a customer's last purchase, Frequency measures how often a customer makes purchases, and Monetary Value calculates the total amount spent by a customer.
By analyzing these three dimensions, businesses can gain valuable insights into customer segments. For example, customers who recently made a purchase, frequently make purchases, and spend a significant amount are considered the most valuable segment. On the other hand, customers who haven't made a purchase for a long time, make infrequent purchases, and spend less are considered less valuable. RFM Analysis enables businesses to tailor their marketing strategies and customer retention efforts to different segments, ultimately improving their overall business performance.
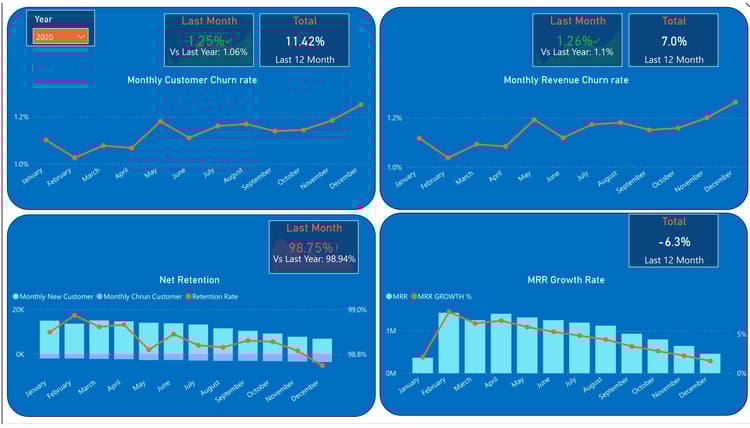
Unveiling Customer Churn Patterns: A Comprehensive Analysis to Enhance Retention Strategies"
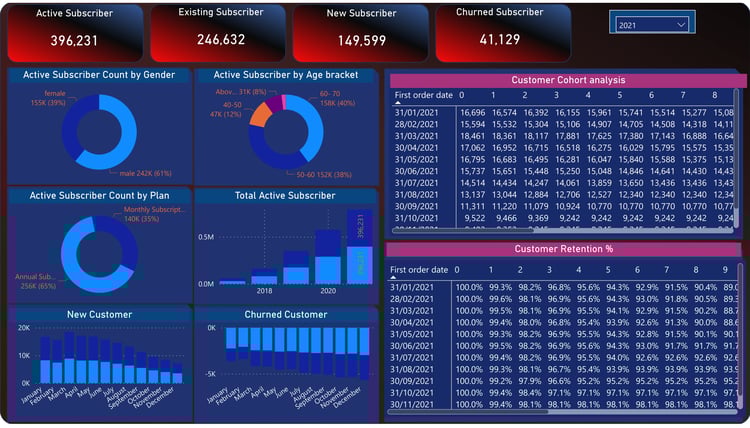
The Evolution of Engagement: Customer Cohort Insights
This dashboard provides an analysis of various key metrics related to customer churn and revenue growth. It presents the monthly customer churn rate, which indicates the percentage of customers that have discontinued their subscription within a month.
Additionally, it displays the monthly revenue churn rate, which calculates the percentage of revenue lost due to customer churn.
The dashboard also includes insights on the monthly count of new customers, churned customers, and the retention rate, which measures the percentage of customers retained over time.
Furthermore, it showcases the monthly recurring revenue (MRR) growth and the MRR growth percentage, indicating the increase in revenue from existing customers. This comprehensive analysis helps in identifying trends, making informed decisions, and implementing strategies to improve customer retention and revenue growth.
This dashboard provides a comprehensive analysis of the subscriber base.
It includes the active subscriber count categorized by gender, age bracket, monthly and annual plan, as well as the count for each year.
Additionally, it highlights the number of new active subscribers on a monthly basis and the churned subscriber count by month.
Furthermore, the dashboard offers a customer cohort analysis which allows for a deeper understanding of customer behavior and trends.
This analysis also includes the retention percentage to assess the effectiveness of customer retention strategies. With this insightful information, businesses can make data-driven decisions and optimize their subscription plans and marketing efforts to better cater to their target audience.
Investor Presentation-A Compelling Investment Opportunity

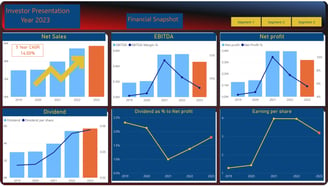
This investor presentation provides a comprehensive overview of the company's financial performance over the past five years.
It includes the net sales trends, which showcase the growth trajectory of the company and highlight its compound annual growth rate (CAGR).
The presentation also covers the EBIDTA trends, offering insights into the company's operational efficiency and profitability.
Additionally, it presents the net profit trends, indicating the company's ability to generate sustainable earnings.
The dividend payout and dividend per share for the past five years are detailed, demonstrating the company's commitment to rewarding its shareholders.
Furthermore, the presentation includes the dividend as a percentage of net profit, providing transparency on the company's dividend policy.
Lastly, the earning per share metric is highlighted, showcasing the company's profitability on a per-share basis.
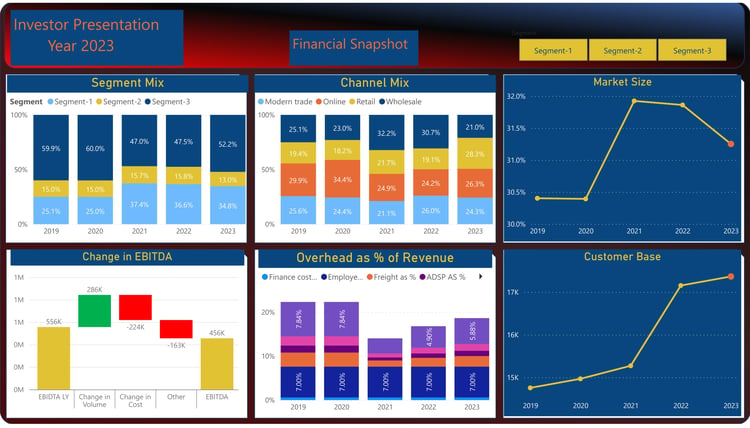
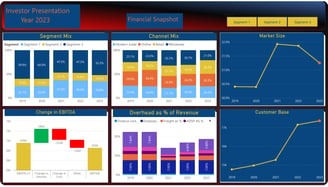
This investor presentation provides a comprehensive overview of the company's performance over the past five years.
It includes a breakdown of the segment mix, showcasing the composition of the company's products or services within each segment.
Additionally, the presentation delves into the channel mix, exploring the company's online, wholesale, retail, and modern trade channels and how they have evolved over the five-year period.
The market size is also highlighted, shedding light on the company's position within the broader industry. The presentation further analyzes the change in EBITDA (Earnings Before Interest, Taxes, Depreciation, and Amortization) due to various factors such as volume, cost, and other influences.
It also examines overhead expenses as a percentage of revenue, giving insights into the company's cost structure. Finally, the presentation provides an overview of the company's customer base, detailing its growth and composition over the past five years.


Common Business Question & Answers
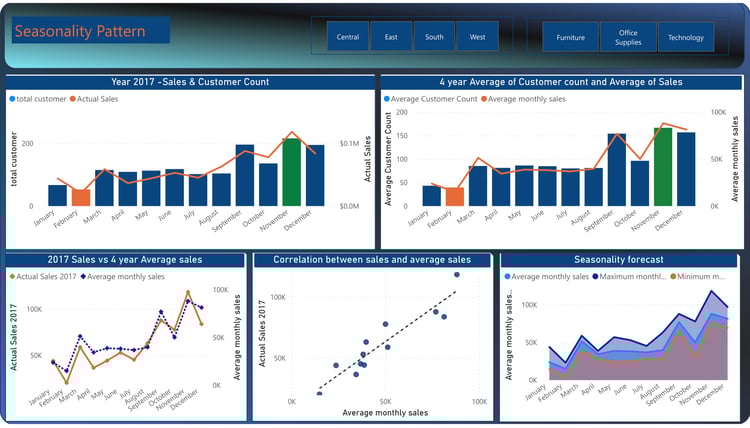

Seasonality Pattern
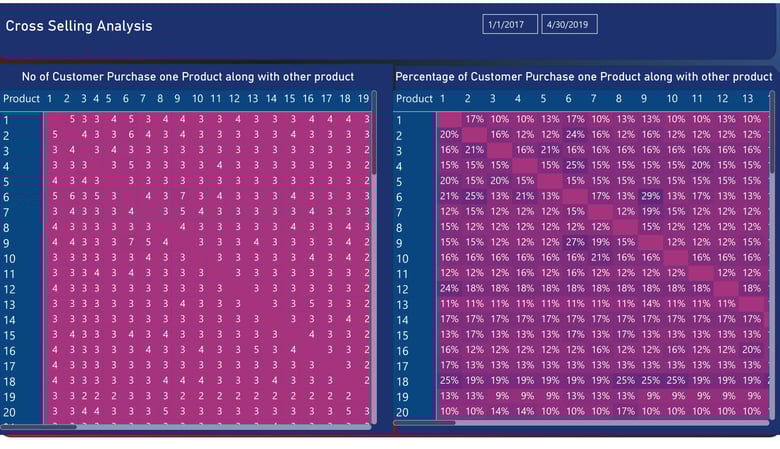

Cross selling analysis is a method used to examine the relationship between different products and identify opportunities for promoting additional items to customers. By analyzing customer behavior and purchase history, businesses can determine which products are frequently purchased together and create targeted marketing strategies. This analysis helps businesses understand customer preferences, optimize product placement, and increase sales revenue. For example, a retailer may find that customers who purchase clothing items also frequently buy accessories like hats or shoes. With this information, the retailer can create special promotions or recommendations to encourage customers to purchase these additional items, thereby increasing their overall revenue. Cross selling analysis is a valuable tool for businesses looking to maximize their sales potential and enhance the customer experience.
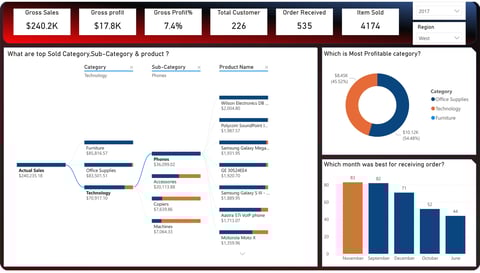
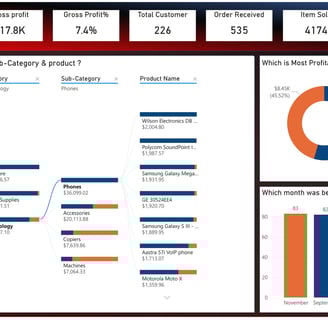
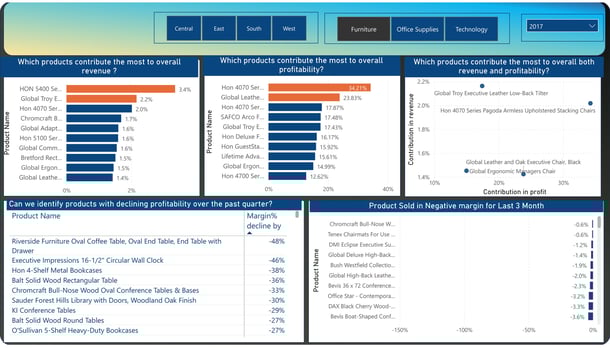
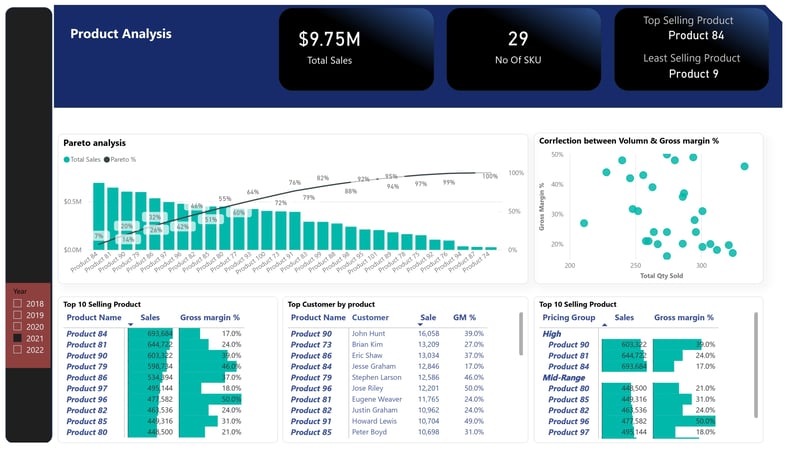
This dashboard provides a comprehensive analysis of various aspects related to product sales.
Pareto analysis, which identifies the most significant products contributing to overall sales. This analysis helps in focusing on the vital few products that account for the majority of sales. Correlation between volume and gross margin percentage is displayed, enabling a better understanding of the relationship between these two variables.
Dashboard highlights the top 10 selling products, providing valuable insights into the best-performing items.
Furthermore, it identifies the top customer for each product, allowing for targeted marketing strategies and personalized customer experiences.
Lastly, the dashboard categorizes products based on their pricing groups, distinguishing between high, mid, and low-priced items. Overall, this dashboard provides a comprehensive overview of product performance, aiding in informed decision-making and efficient sales strategies.
Basket analysis, also known as market basket analysis, is a technique used in data mining and analytics to uncover relationships between items purchased together by customers.
By analyzing transaction data, such as receipts or online purchase records, basket analysis aims to identify patterns and associations among different products or services. This information can then be used to improve marketing strategies, optimize product placement, and cross-sell or upsell related items.
For example, a grocery store might discover that customers who purchase bread are also likely to buy butter and milk. This insight could prompt the store to place these items in close proximity to each other to encourage additional purchases.
In essence, basket analysis helps businesses gain a deeper understanding of customer behavior and preferences, enabling them to make more informed decisions that drive sales and enhance customer satisfaction.
Maximizing Revenue Streams: Analyzing Product Cross-Selling Opportunities for Enhanced Sales Strategies
Unlocking Customer Preferences: A Comprehensive Market Basket Analysis for Insightful Business Strategies
Product Pareto: Focusing on the Vital Few for Maximum Impact
Financial
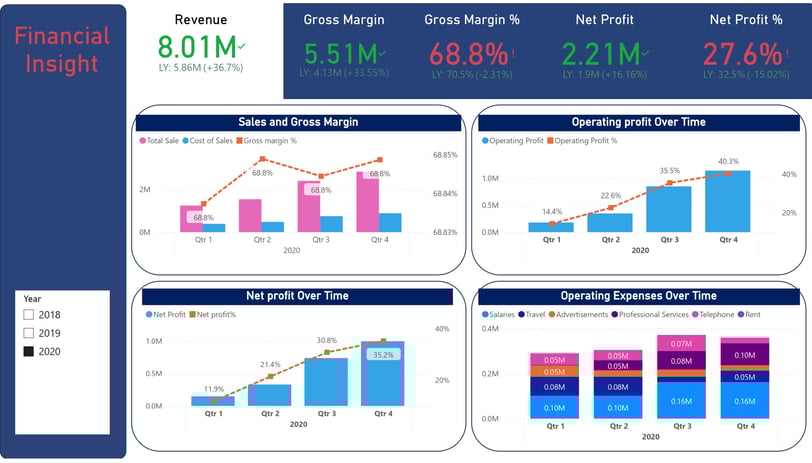
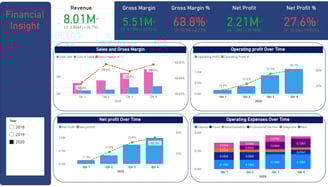
This financial insight dashboard offers a comprehensive overview of the company's financial performance.
It provides detailed information on key metrics such as sales cost and gross margin percentage by quarter, allowing for a clear understanding of the company's profitability.
Additionally, the dashboard presents data on operating profit and operating profit percentage by quarter, giving insights into the company's operational efficiency.
The net profit and net profit percentage by quarter are also displayed, providing a holistic view of the company's overall financial health.
Furthermore, the dashboard breaks down operating expenses by major categories such as salary, travel, advertisement, professional fees, and communication, allowing for a detailed analysis of expenditure patterns quarter by quarter.
This comprehensive financial insight dashboard serves as a valuable tool for monitoring and optimizing the company's financial performance.
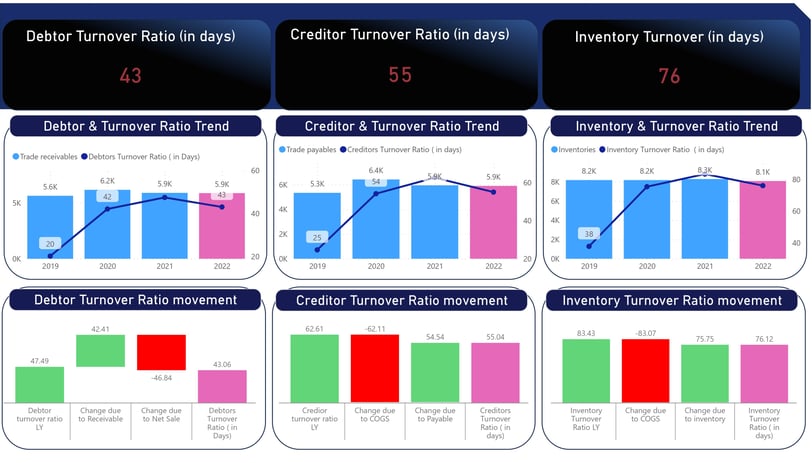
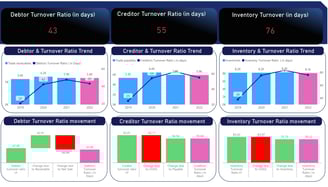
Creditor Turnover Ratio measures how quickly a company pays its trade creditors. In our analysis, a decrease from 63 days in 2021 to 55 days in 2022 was observed. The reduction was influenced by a negative 62-day impact from cost reduction, indicating lower cost of goods sold, and a 54-day impact from changes in payables, suggesting extended payment terms to suppliers.
The Debtor Turnover Ratio measures how efficiently a company collects payments from its customers within a specific period.
In the context of your explanation, the Debtor Turnover Ratio decreased from 47 days in 2021 to 43 days in 2022, indicating that it took longer to collect payments from customers. This decrease was primarily influenced by a negative 49-day impact from reduced sales, indicating a drop in sales volume. Additionally, there was a 43-day impact from increased accounts receivable, suggesting a delay in the collection of customer invoices. These changes highlight challenges in managing cash flow and customer payment dynamics
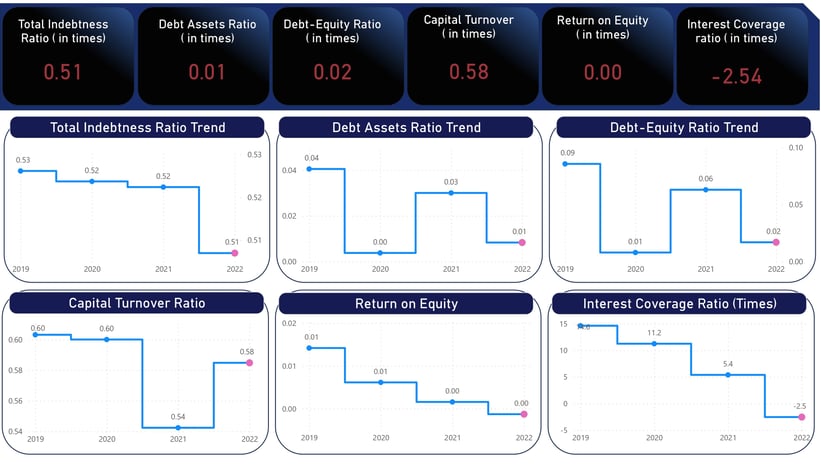
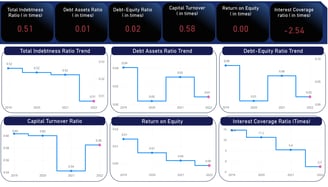
The total indebtedness ratio is a financial metric used to assess the overall level of debt of a company. This ratio provides insights into the company's ability to meet its financial obligations and indicates its level of leverage.
The debts assets ratio, on the other hand, measures the proportion of a company's assets that are financed through debt. It is calculated by dividing the total debts of a company by its total assets. A higher debts assets ratio indicates a higher level of debt financing.
The debts-equity ratio compares a company's total debts to its total equity, providing insights into the company's capital structure and financial risk.
The capital turnover ratio, on the other hand, measures how efficiently a company utilizes its capital to generate sales. It is calculated by dividing the company's net sales by its average total assets.
The return on equity ratio measures the profitability of a company by comparing its net income to its shareholders' equity.
Lastly, the interest coverage ratio assesses a company's ability to meet its interest expenses. It is calculated by dividing the company's earnings before interest and taxes (EBIT) by its interest expenses.
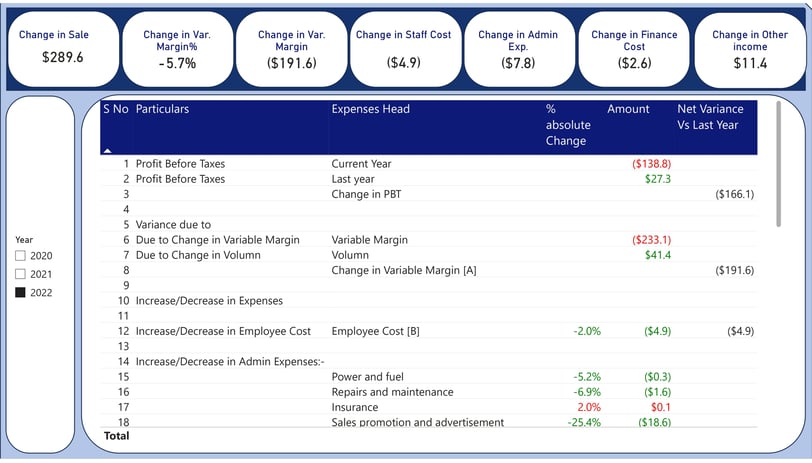
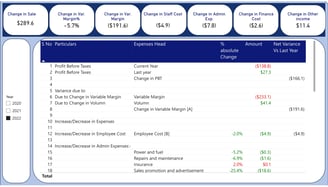
This dashboard provides an overview of the difference in profit before taxes compared to last year's profit before taxes.
The main factors contributing to this variance are the changes in variable margin, employee cost, administrative expenses, other income, and depreciation.
By analyzing these aspects, businesses can gain valuable insights into the specific areas that have led to an increase or decrease in profit.
This information can help management make informed decisions and take necessary actions to optimize profitability.
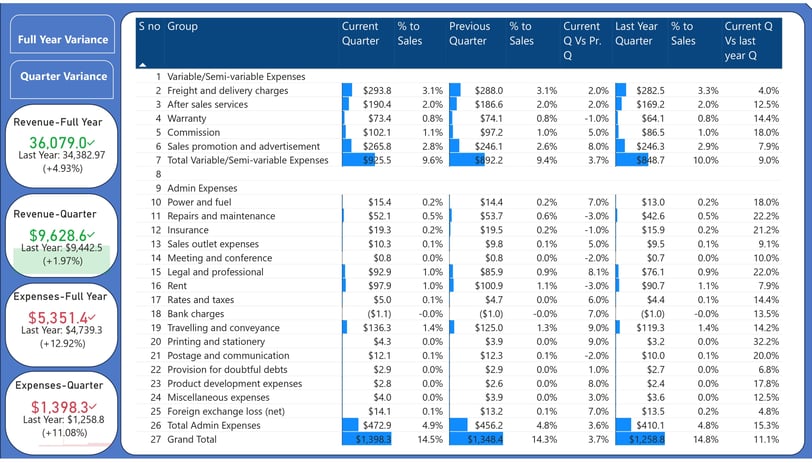
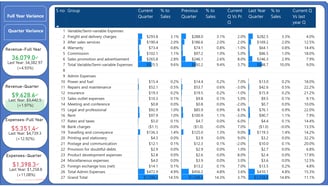
This dashboard provides a comprehensive breakdown of expenses for the entire year, as well as a comparison to the previous year.
It also displays the percentage of expenses in relation to sales and the variance compared to the previous year.
Additionally, there is a button that allows users to adjust the variance by quarter.
This can be done by selecting the current quarter, the corresponding quarter from the previous year, the previous quarter, or by comparing the percentage to sales or the variance against the previous year's quarter.
The dashboard offers a visually appealing and user-friendly interface to analyze and track expenses over time.
The expenses detail section helps analysts and investors understand the specific areas where the company is spending its money and how it affects its overall profitability. By analyzing this section, stakeholders can assess the efficiency of the company's operations and make informed decisions regarding its financial health
Comprehensive Financial Insight overview- offering a detailed analysis of key fiscal metrics and trends
Ratio Analysis, revealing key insights into liquidity, profitability, and overall fiscal health
Explore a detailed breakdown of expenses to enhance financial transparency and control
Variance Analysis


Competition Analysis
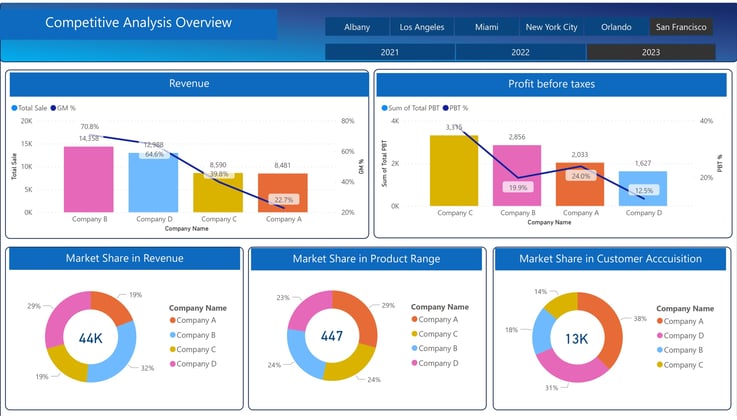
The competition analysis dashboard provides valuable insights into the performance of four companies.
First chart compares their revenue, allowing for a comprehensive understanding of their financial positions. Second chart showcases the profit before tax for each company, enabling a comparison of their profitability. Market share donut chart the market share breakup based on revenue, giving a clear picture of each company's standing within the market.
Market share by product range, indicating which products are dominating the market.
Market share by customer number, offering insights into the customer base of each company.
Overall, this analysis provides a comprehensive overview of the competition, enabling effective decision-making and strategic planning.
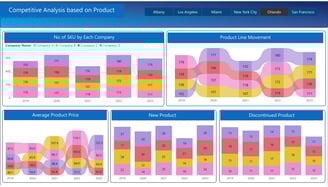
This competition analysis dashboard provides a comprehensive overview of various aspects in the market.
It allows company to compare the number of SKUs they offer with compare to other company, analyze product line movements, and compare average product prices.
Additionally, it provides insights on new product introductions and discontinued products.
This information is crucial for businesses to make informed decisions and stay competitive in the market. With this dashboard, companies can easily identify gaps in their product offerings, track market trends, and strategize accordingly. It serves as a valuable tool for analyzing the competition and staying ahead in the ever-evolving market landscape.
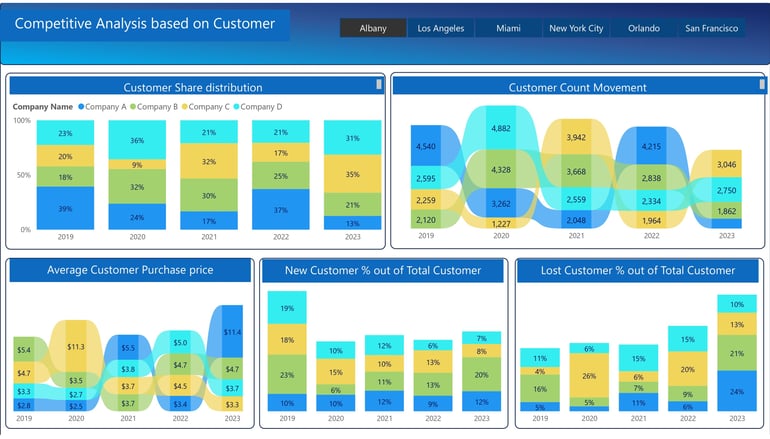
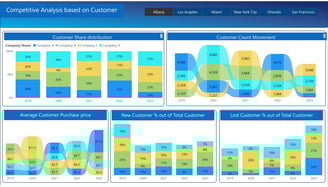
The competition analysis dashboard provides a comprehensive overview of the customer share among different companies.
This dashboard allows businesses to gain valuable insights into their performance in relation to their competitors. By analyzing customer share, companies can understand their position in the market and identify areas for improvement. The customer count movement helps to gauge the growth or decline in customer base over time. The average customer purchase price is an important metric to monitor profitability, while the percentages of new and lost customers highlight the company's ability to attract and retain clientele. Overall, this dashboard offers a detailed analysis of key customer-related metrics to guide strategic decision-making.
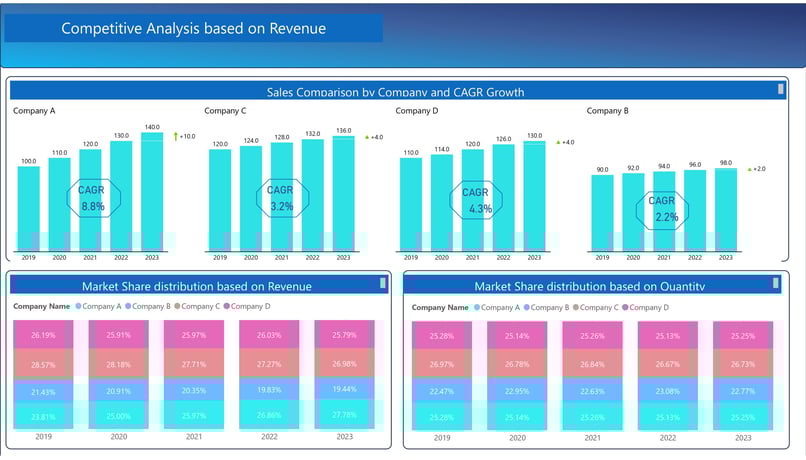
The competition analysis provides a comprehensive overview of the revenue comparison between the company and its competitors over a period of five years. This analysis focuses on the compound annual growth rate (CAGR) of the company's revenue.
It highlights the market share distribution based on revenue for each year, showcasing how the company's revenue compares to that of its competitors. Additionally, the analysis also examines the market share based on quantity for each year, providing insights into the company's performance in terms of the quantity of goods or services sold compared to its competitors. These detailed analyses allow for a thorough understanding of the company's position in the market and its growth trajectory.
Competition Analysis overview- providing insights into market dynamics, trends, and competitor strategies
Product-focused Competition Analysis-offering insights into competitive landscapes and strategic opportunities
Competition Analysis based on customer insights, ensuring a competitive edge in the market
Competition Analysis based on revenue insights, enabling strategic decisions and market positioning
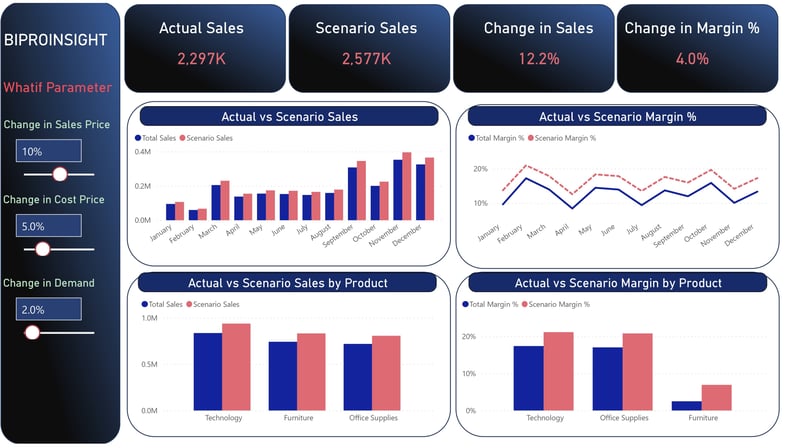

The What-If analysis you've conducted involves four key charts to help you understand the impact of changing variables on your business. The first chart, "Actual Sales vs. Scenario Sales by Month," compares your actual monthly sales data with scenarios based on changes in sales prices, costs, and demand. This provides a clear picture of how these changes affect your sales on a monthly basis.
"Actual Sales vs. Scenario Gross Margin by Month," shifts the focus to gross margin, showing how changes in the same variables impact your profitability over time. It allows you to assess how different scenarios affect your financial performance month by month.
"Actual Sales vs. Scenario by Product" and "Actual Margin vs. Scenario by Product," provide a product-level perspective. They break down sales and margins by product category, revealing which products are most affected by the changes and helping you make informed decisions about product-specific strategies and pricing. These charts collectively empower you to explore and visualize the potential outcomes of different business scenarios, enabling you to make data-driven decisions to optimize your business performance.
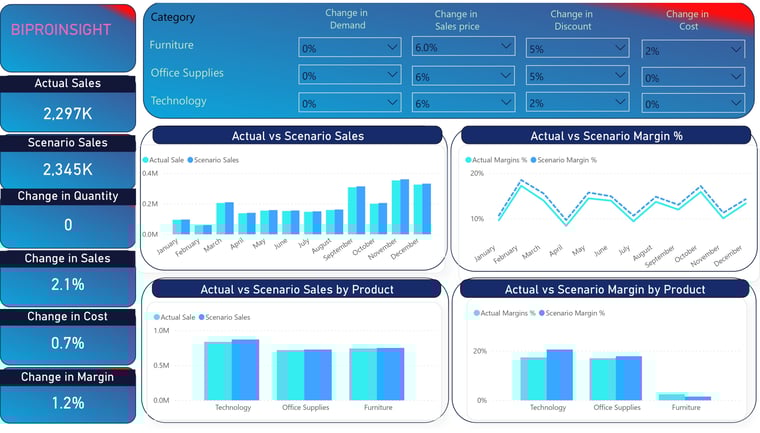
In this advanace What-If analysis, examined how alterations in sales prices, costs, and demand affect business performance. The first chart, "Actual Sales vs. Scenario Sales by Month," allows to compare actual monthly sales with various scenarios reflecting these changes. It provides a clear view of how fluctuations in sales prices, costs, and demand impact your monthly sales figures, helping you gauge the potential financial impact over time.
"Actual Sales vs. Scenario Gross Margin by Month," takes a deeper dive into profitability. It tracks the actual gross margin – the difference between revenue and the cost of goods sold – against scenarios considering adjustments to pricing, costs, and demand. This chart provides insights into how these changes influence your monthly profitability, which is critical for financial planning and decision-making.
"Actual Sales vs. Scenario by Product" and "Actual Margin vs. Scenario by Product," zoom in on individual product categories. They show how each product category's sales and gross margin are affected by changes in pricing, costs, and demand. This level of detail empowers you to make informed decisions about product-specific strategies, pricing adjustments, and resource allocation, ultimately helping you optimize the performance of your different product categories. These charts collectively offer a comprehensive view of your business's financial health under various scenarios, guiding you in making data-driven decisions to enhance your overall profitability.
Navigating Scenarios: Exploring Potential Outcomes through What-If Analysis
Strategic Exploration: Unveiling Possibilities with Multi-Criteria What-If Analysis

Customer Churn

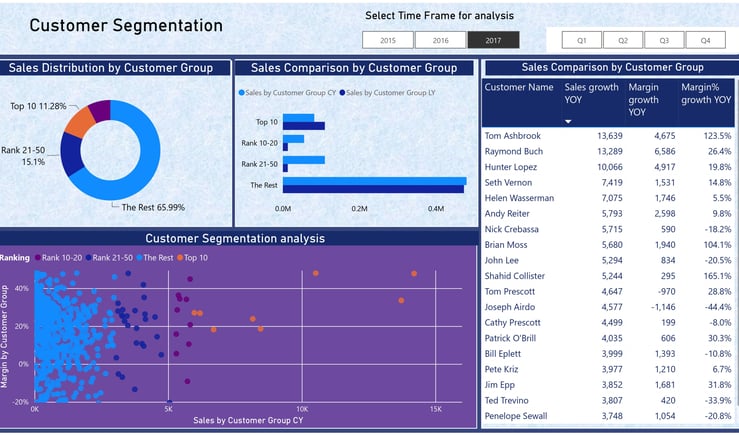
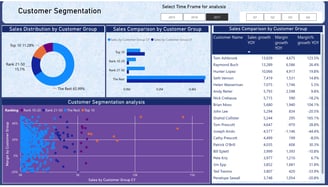
This customer segmentation dashboard provides an analysis of various aspects.
Firstly, it shows the Sales distribution among different customer groups, specifically highlighting the sales by the top 10 customers, the sales by customers ranking between 21 and 50, and the sales by the rest of the customers.
Sales comparison by customer group presents a comparison of sales with the previous year, allowing for a clear understanding of the growth or decline in sales.
Customer Segmentation dashboard includes a scatter chart that visually represents the correlation between sales and margin for each customer group, providing insights into the profitability of different customer segments.
Lastly, there is a table displaying the customer sales growth and margin growth year-to-date, providing a comprehensive overview of the performance of the customers.
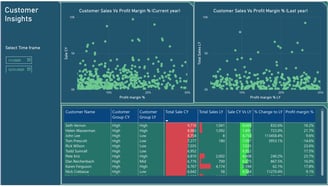
This customer insight dashboard provides a comprehensive analysis of the sales and profit margin correlation for the current and previous years.
The scatter chart visually represents the relationship between sales and profit margin percentage for the current year, allowing for easy identification of any patterns or trends.
Similarly, the scatter chart for the previous year offers insights into how this correlation has evolved over time.
Table is included to rank customer groups based on their total sales for the current and previous years, as well as their growth and profit margin percentages. This table categorizes the customer groups into high, low, and medium based on their performance in these areas. With this dashboard, businesses can gain valuable insights into their sales and profit margins, allowing them to make informed decisions and optimize their strategies for future growth.
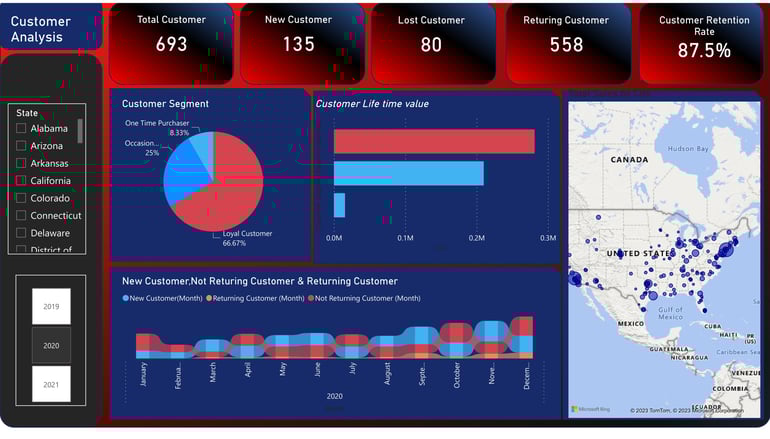
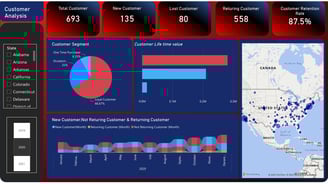
The customer churn dashboard provides a comprehensive analysis of various customer segments, including one-time customers, occasional customers, and loyal customers.
It also showcases the lifetime value of each customer segment, allowing businesses to identify the most valuable customers.
Dashboard highlights the monthly patterns of new customers, non-returning customers, and returning customers, which helps in understanding customer behavior and trends over time.
There is a visually appealing world map that displays the distribution of customers across different states, providing insights into geographical customer preferences. With this dashboard, businesses can effectively monitor and strategize customer retention efforts, ultimately improving their overall customer satisfaction and loyalty.
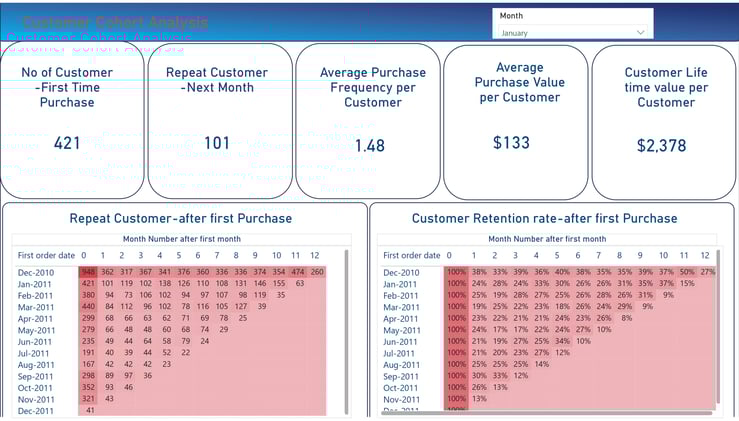
This customer cohort dashboard provides key performance indicators (KPI) related to customer behavior.
The first KPI is the number of customers who made their first purchase in the selected month.
The second KPI measures the number of customers who made repeat purchases out of the aforementioned group.
The third KPI calculates the average purchase frequency per customer.
The fourth KPI focuses on the average purchase value per customer.
Lastly, the dashboard presents the customer lifetime value. The dashboard includes two charts. The first chart depicts the number of repeat customers after their first month of purchase. The second chart represents this information in percentage form.
Decoding Customer Insights: Unveiling Patterns for Business Growth
Tailored Strategies: Unveiling Opportunities Through Customer Segmentation
Mapping Momentum: Analyzing Customer Movement for Strategic Insights
"Understanding Customer Behavior Over Time: A Cohort Analysis to Drive Strategic Insights"


Sales & Gross Margin analysis
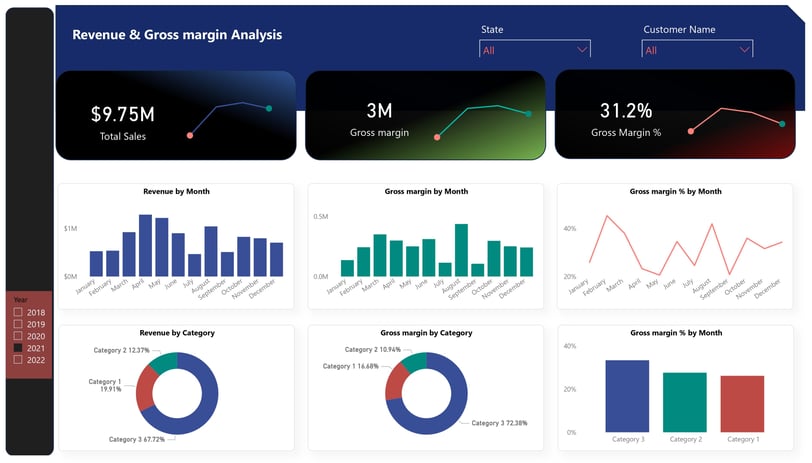
The Sales and gross margin dashboard provides a clear overview of the revenue and gross margin trends by month and category.
This dashboard allows users to track the revenue generated and the corresponding gross margin percentage on a monthly basis.
It also provides insights into the revenue and gross margin performance across different categories.
By analyzing these metrics, businesses can identify the most profitable months and categories, as well as track the overall profitability of their operations. This dashboard is a valuable tool for understanding and optimizing sales and gross margin, enabling businesses to make informed decisions and drive growth.
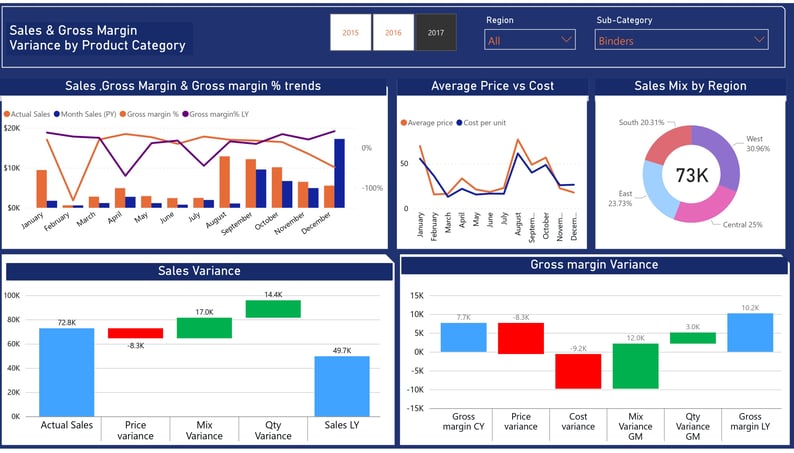
This sales and gross margin dashboard provides a comprehensive analysis of key metrics.
It includes the sales and gross margin figures by month, comparing them to the previous year for easy comparison and trend analysis.
Additionally, it highlights the average sales price versus the cost by month, allowing for an assessment of profitability.
The dashboard also breaks down the sales mix by region, providing insights into the performance of different markets.
It offers a detailed analysis of the sales variance compared to the previous year, focusing on price variance, mix, and quantity. Lastly, it tracks the gross margin variance, examining the impact of price, cost, mix, and quantity. Overall, this dashboard offers a holistic view of sales and gross margin performance, enabling effective decision-making and strategic planning.
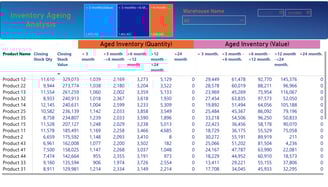
Inventory Ageing Analysis
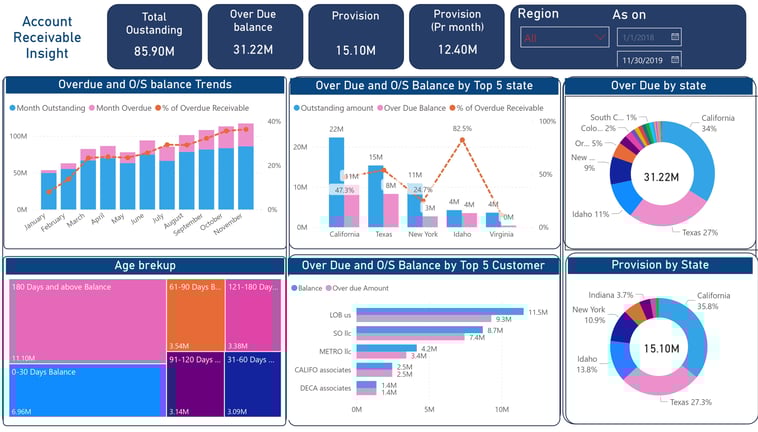
Account Receivable Insight
Ageing Analysis
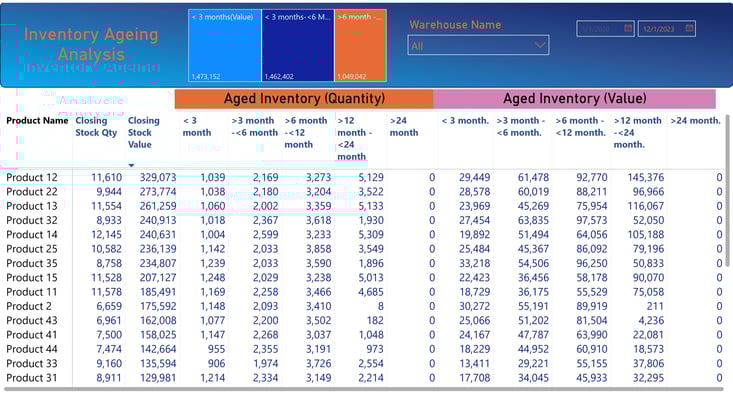
The inventory ageing analysis provides a breakdown of the overage inventory based on different age groups. The first group includes inventory that is between 1 and 3 months old, while the second group consists of inventory aged between 3 and 6 months. The third age group covers inventory that is between 6 and 12 months old, and the fourth group includes inventory between 12 and 24 months old. Finally, the fifth group encompasses inventory that is over 24 months old. This analysis allows us to identify and address any potential issues related to stagnant inventory, enabling us to optimize our inventory management and make informed decisions regarding stock control and replenishment.
This account receivable dashboard provides a comprehensive overview of the company's financial status.
It displays key information such as the amount of overdue and outstanding payments, as well as the percentage of overdue payments by month. Additionally, the dashboard showcases the breakdown of overdue and outstanding balances by the top 5 states, allowing for a better understanding of regional payment trends.
The chart also presents the mix of overdue payments by state, offering insights into areas that require further attention.
Aging breakup section categorizes overdue payments into different age groups enabling the company to analyze the extent of overdue payments.
The dashboard also highlights the overdue and outstanding balances of the top 5 customers, aiding in identifying high-risk clients. Lastly, the provision breakup section provides an overview of provisions made by state to manage potential bad debts.

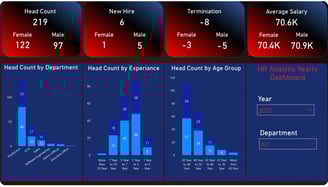
HR Dashboard
Salary Variance
Head Count analysis
This dashboard provides a comprehensive analysis of head count across different parameters. It presents the head count by department, allowing for a clear understanding of the distribution of employees across various functional areas. Additionally, it showcases the head count by experience, showcasing the distribution of employees based on their tenure within the organization. Furthermore, the headcount by age group provides insights into the age demographics of the workforce. Together, these visualizations enable a holistic view of the organization's head count, facilitating informed decision-making and strategic planning.
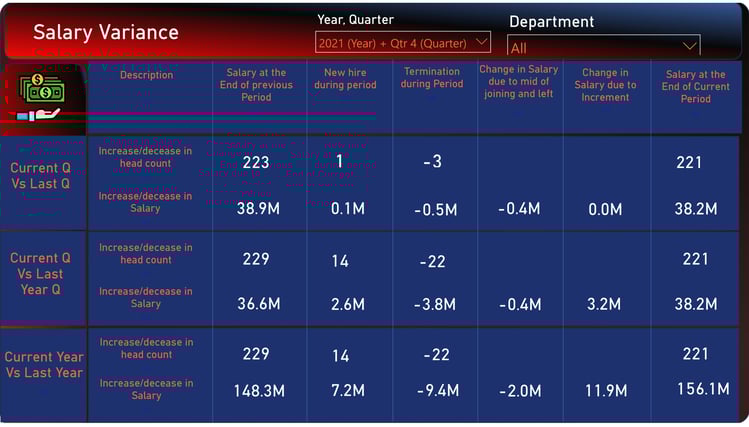
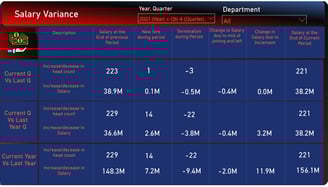
This dashboard provides a visual representation of the salary variance analysis for the current quarter compared to the last quarter, the current quarter compared to the same quarter last year, and the current year compared to the previous year.
The analysis is broken down into three categories: increase or decrease in headcount, increase or decrease in salary, and increase or decrease due to new or left employees.
This dashboard allows for easy comparison of salary changes over time and helps identify trends and patterns in the organization's salary structure.

Price & Discount analysis
Variance Analysis
Travel Expenses Variance Analysis
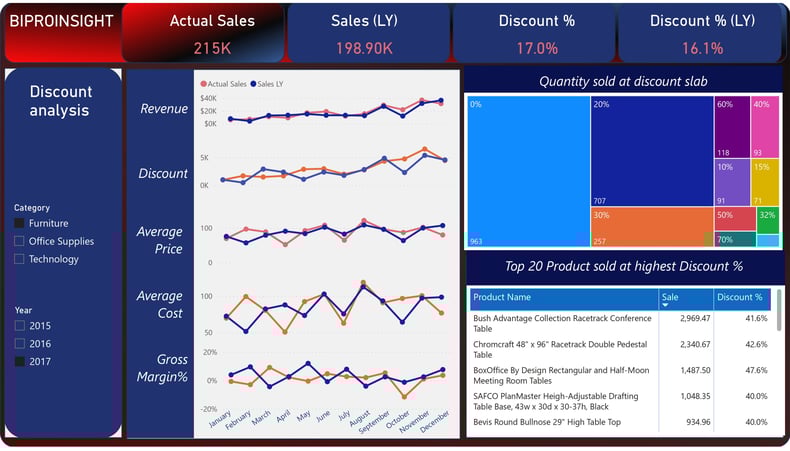
This dashboard provides a comprehensive analysis of price and discount trends.
It includes revenue trends, discount trends, and average price/average cost trends.
The treemap chart visually displays the quantity of products at different discount slabs.
Additionally, it showcases the top 20 products sold at the highest discount percentage.
Users have the option to filter the data by category and year, allowing for a more targeted analysis.
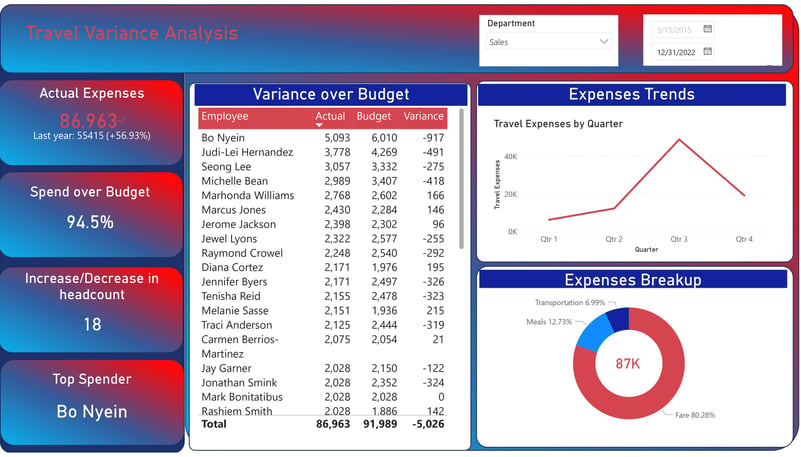
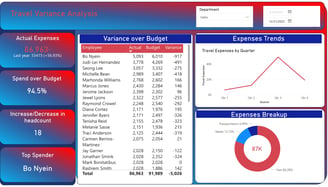
This dashboard provides a comprehensive analysis of travel variances by employee, comparing them to the budget.
It also displays the current trends in travel and the breakdown of expenses into categories such as transportation, meals, and fare.
This information is essential for businesses to track employee travel expenses and ensure they align with the allocated budget.
By analyzing the variances, companies can identify any discrepancies and take necessary actions to optimize travel expenditure.
The breakdown of expenses allows companies to understand the major cost drivers and make informed decisions regarding travel policies and guidelines.
With this dashboard, organizations can effectively manage their travel expenses and make data-driven decisions to enhance cost-efficiency and budget control.


Get in touch
Prateekca7@Gmail.com